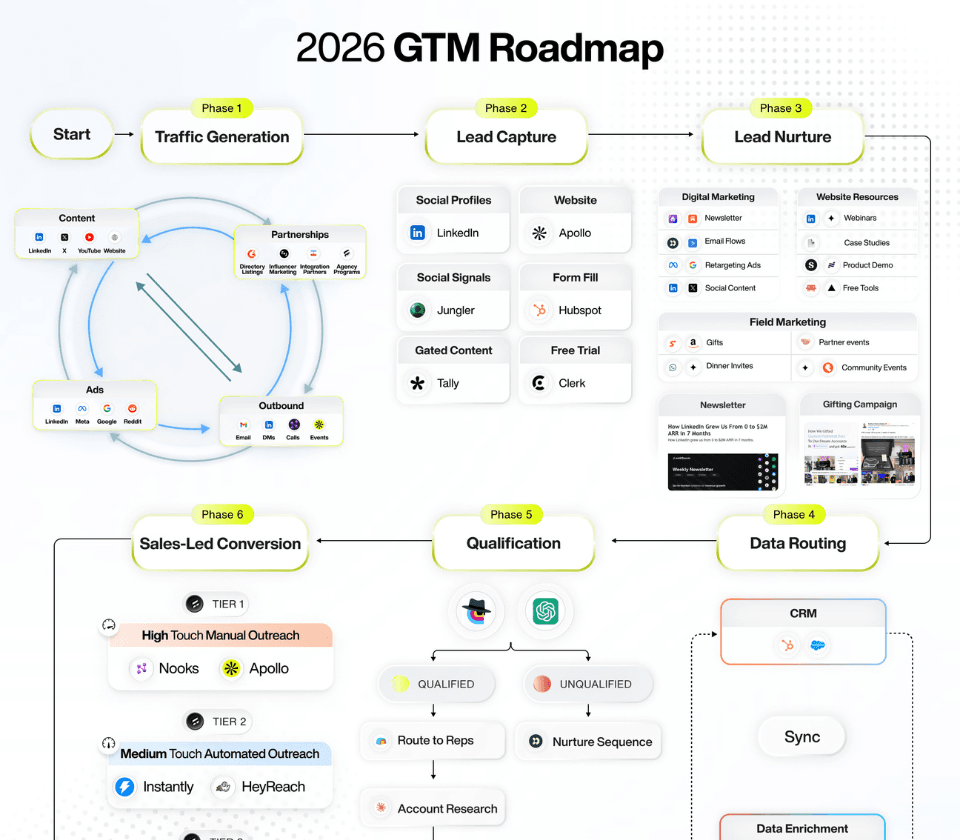
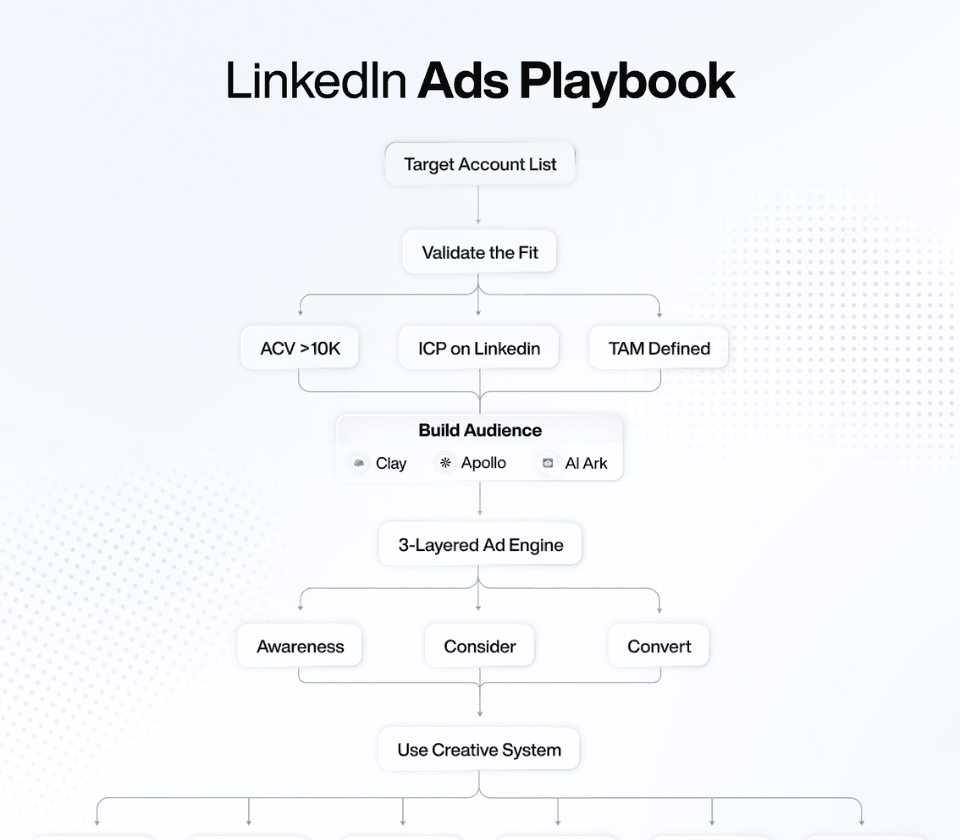
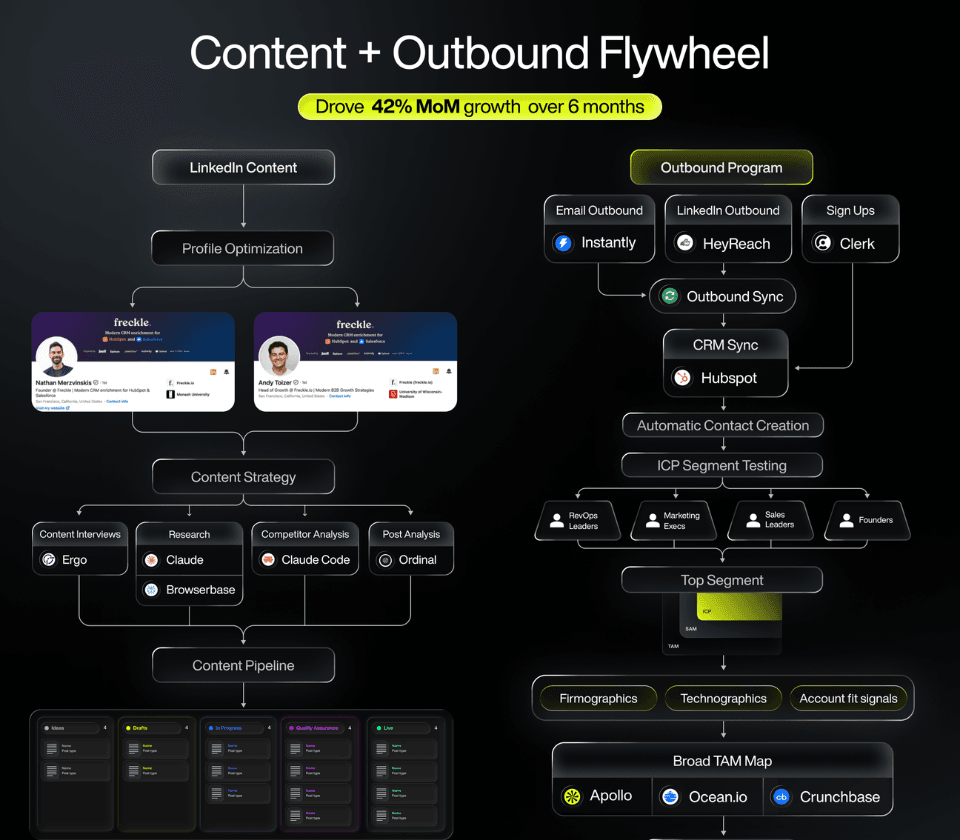
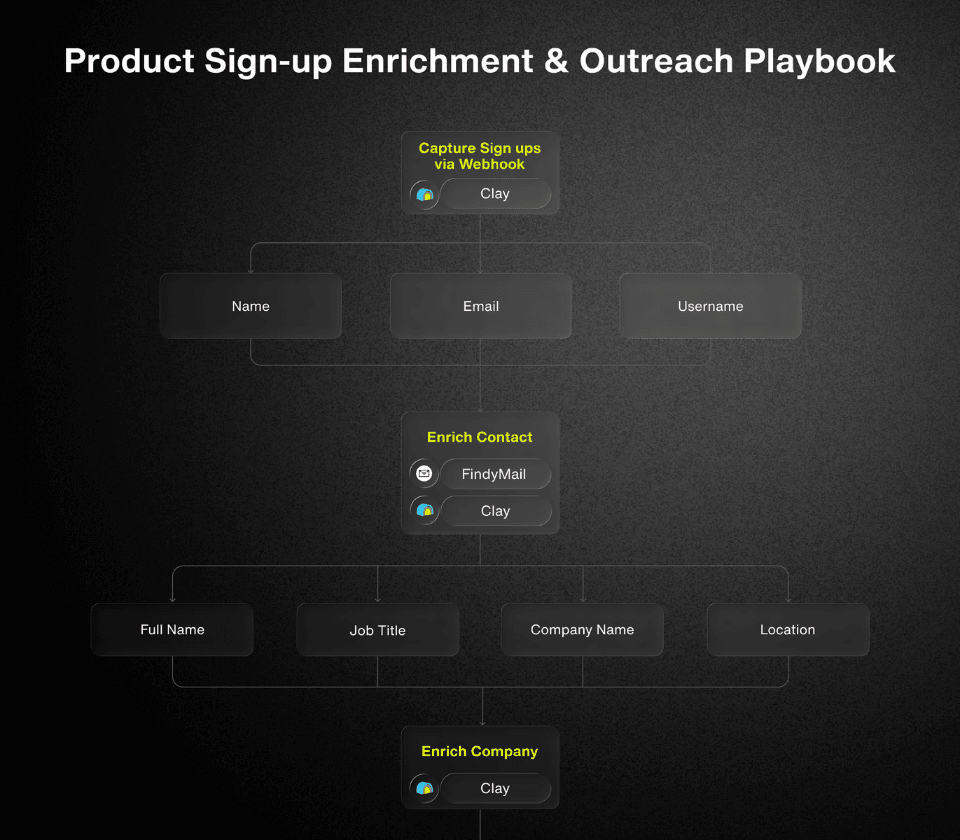
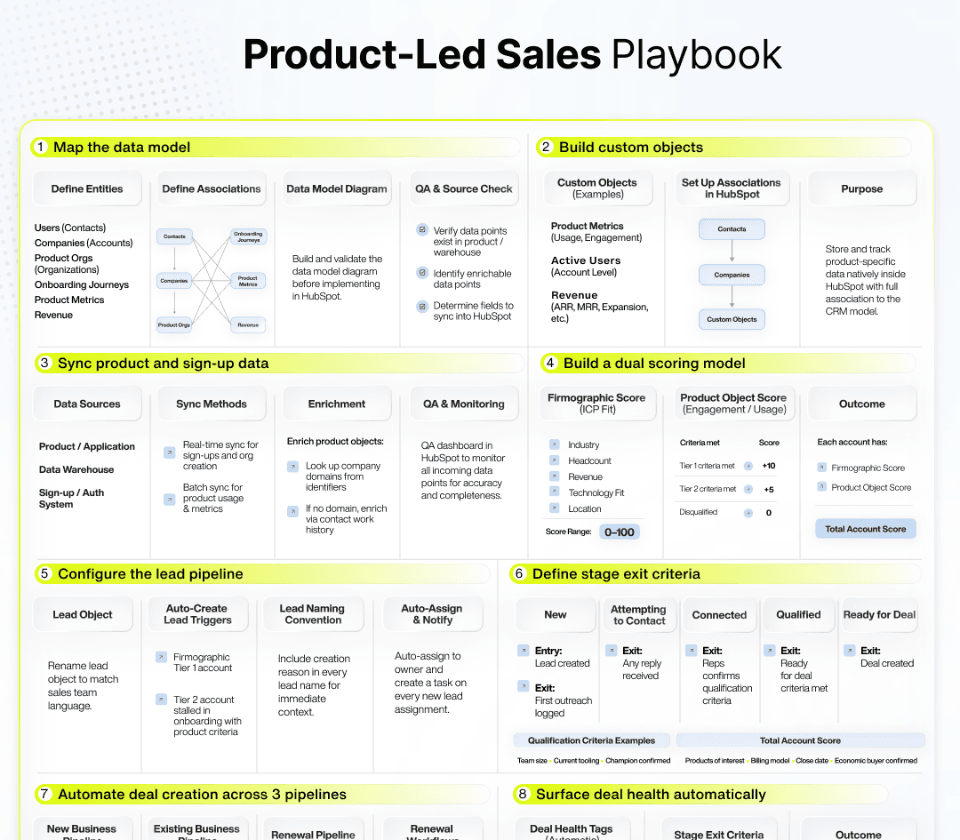
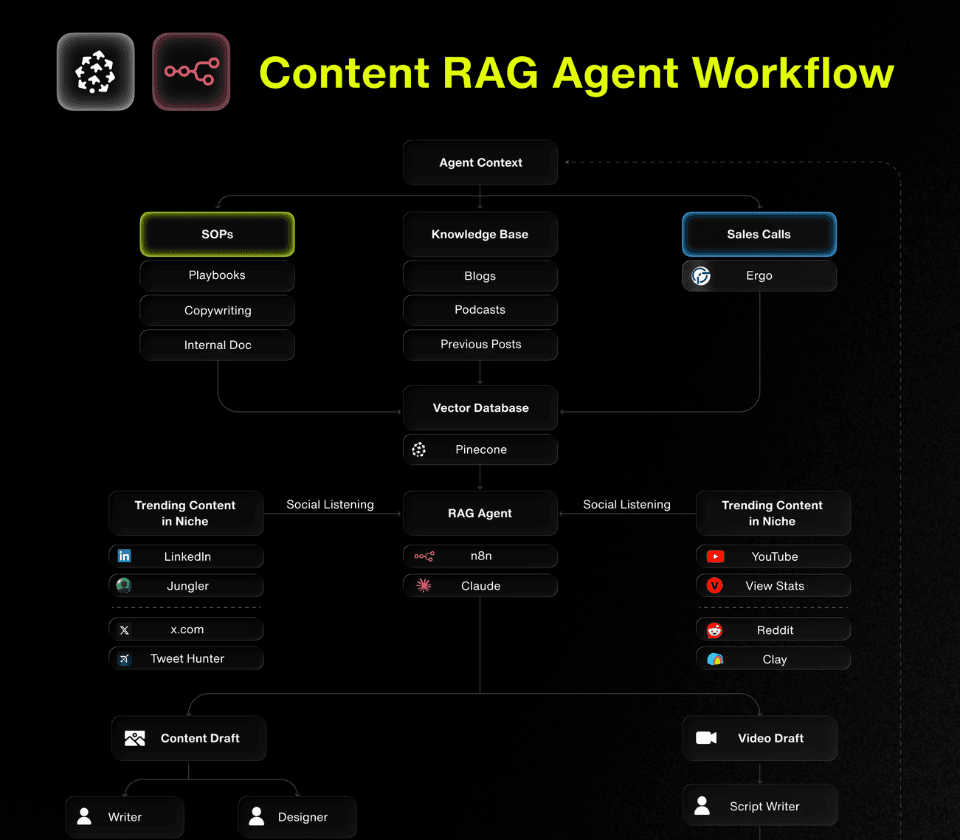
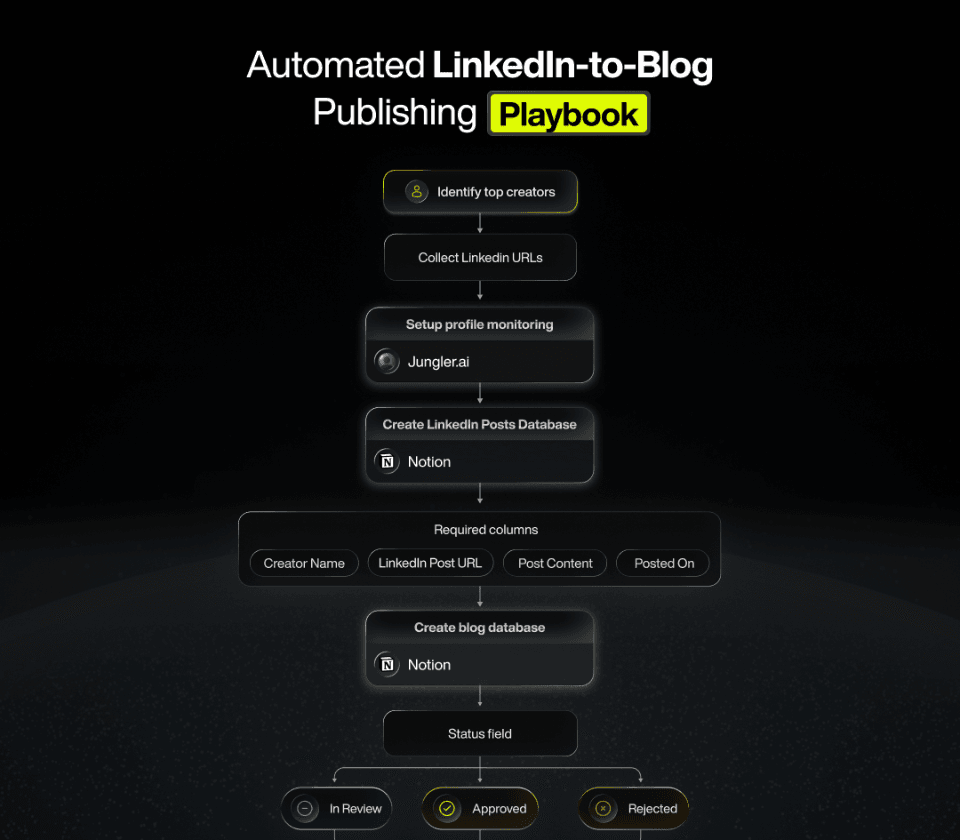
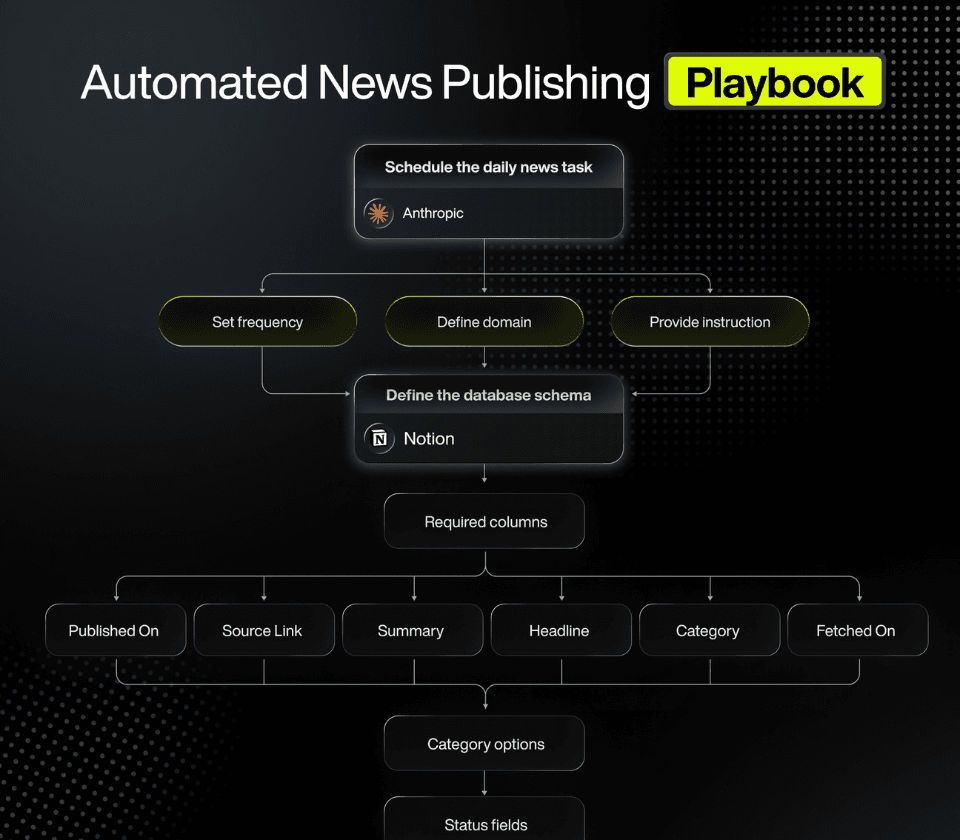
The 7-Step Outbound GTM Framework That Booked 320+ Meetings
Most outbound sales programs fail for the same predictable reasons.
They struggle with unclear ICP definitions, incomplete TAM mapping, unreliable data, shallow account research, and inconsistent messaging.
When these foundational components don’t align, multichannel outbound becomes chaotic.
Reply rates decline. Deliverability drops. Pipeline generation stalls.
And it’s not because outbound doesn’t work, it’s because the system behind it is missing.
Our Outbound GTM Framework was built to solve exactly this problem.
In one month, it booked 320+ qualified meetings, not because of luck or volume, but because every stage of the workflow was systemized and data-driven.
Here’s what that looks like in practice:
- ICP Modeling defines precise targeting rules so every prospect fits the ideal profile.
- TAM Mapping ensures full market visibility, every potential account is mapped, not guessed.
- Account Enrichment adds depth and context, so SDRs approach each conversation intelligently.
- Scoring Models prioritize outreach, focusing reps where the highest buying signals exist.
- Message-Market Fit Testing validates copy before scaling, so every sequence converts consistently.
Each element is repeatable, measurable, and interconnected, forming the backbone of a scalable outbound engine.
This playbook breaks down the exact 7-step Outbound GTM Framework behind that performance.
You’ll learn how clean data, structured research, and signal-based prioritization turn outbound from a guessing game into a predictable, compounding growth system.
We’ll go step by step through how modern teams design, execute, and optimize their GTM engines with real-world reasoning and frameworks you can apply immediately.
Outbound, when built correctly, isn’t a volume race.
It’s a system of precision, consistency, and clarity and this guide will show you how to build it from the ground up.
Step 1: ICP model
The Ideal Customer Profile (ICP) model is the control system for any outbound GTM motion.
If this foundation is vague or shallow, every downstream process: TAM mapping, enrichment, scoring, and messaging becomes noisy, inefficient, and hard to scale.
A strong ICP isn’t about guessing who might buy. It’s about building a data-driven definition of who actually buys, why they buy, and what differentiates them from everyone else in the market.
How we build the ICP model
We treat ICP modeling as a data problem, not a brainstorming exercise.
Three structured input streams drive our approach:
1. Onboarding form
For every client, we start with a standardized onboarding form.
This captures essential details about the business, converting qualitative preferences into
quantifiable, queryable criteria.
We collect:
- Core firmographics: industry, sub-industry, headcount ranges, operating regions, revenue tiers.
- Commercial model: ACV bands, sales cycle length, product-led vs. sales-led motion, demo vs. free trial.
- Ideal customer traits: which segments close fastest, retain longest, or expand most.
- Negative ICP: which segments waste cycles, churn early, or rarely convert.
- Historical performance: which past campaigns, channels, or segments succeeded or failed.
This form creates the first level of structure, ensuring the ICP reflects measurable facts, not opinions.
2. SDR & CSM interviews
Next, we validate and enrich the form’s data by interviewing the people closest to customers: the **SDRs, AEs, and CSMs.**
These conversations surface front-line insights that data alone can’t capture:
- SDRs: Which personas consistently reply? Which titles ignore everything? What objections come up early?
- AEs/CSMs: Which customers find value fastest? Who gets stuck in onboarding? Who expands over time?
- Patterns: What specific language do buyers use to describe their problems and desired outcomes?
This layer injects real-world nuance into the ICP, bridging the gap between assumed buyer behavior and observed buyer behavior.
3. Closed-won analysis
Finally, we review the past six months of closed-won deals and top-performing customers.
This ensures our ICP isn’t just logical, it’s backed by revenue data.
We analyze:
- Firmographic and technographic patterns across wins.
- Thresholds: e.g., “teams under 20 employees rarely convert.”
- Pre-purchase triggers: funding events, executive hires, new product launches, or compliance milestones.
- Expansion behavior: who grows fastest post-sale, and what traits predict long-term success.
This closes the loop between assumptions, interviews, and outcomes, anchoring ICP definition in empirical data.
Outputs: what a working ICP model looks like
From these inputs, we produce a living ICP model that can be operationalized in tools like **Apollo, LinkedIn Sales Navigator, Clay, or any enrichment platform.**
1. ICP criteria
A detailed description of the ideal customer, expressed as rules, not narratives:
- Firmographic: industry, sub-industry, employee count, region, revenue band.
- Technographic: required or disqualifying tools, integrations, or stack patterns.
- Behavioral: hiring velocity, funding activity, regulatory exposure, or content activity.
- Negative Criteria: markets or models we deliberately exclude to avoid wasted cycles.
This becomes the master reference document used by SDRs, AEs, marketing, and operations teams alike.
2. Filters & queries
We then convert ICP rules into filter logic that can be repeatedly executed in data tools.
This eliminates the “reinvent targeting” problem before every campaign.
Typical examples include:
- Saved searches in Apollo or Sales Navigator (industries, seniority, function, region).
- Boolean strings for title and keyword logic.
- Inclusion and exclusion lists (e.g., known high-fit domains, blacklisted competitors, or irrelevant geographies).
These filters operationalize the ICP so that targeting is consistent, scalable, and repeatable.
3. Lookalike signals
The final step is defining lookalike signals to expand total addressable market (TAM) intelligently.
Instead of relying on “companies that look like X,” we seek “companies that behave like our best customers.”
Examples include:
- Unique combinations of tools that correlate with high win rates.
- Specific hiring or content patterns that signal growth.
- Website traffic ranges or funding signals linked to conversion likelihood.
These signals fuel TAM expansion and make the next step of the outbound GTM framework (Step 2: TAM Mapping) significantly more accurate.
Step 2: TAM mapping
Once your ICP model is defined, the next question becomes:
How many accounts actually fit this profile and where are they?
That’s the purpose of Total Addressable Market (TAM) Mapping.
It’s not about pulling lists from Apollo or LinkedIn. It’s about creating a complete, structured, and de-duplicated universe of accounts that match or closely resemble your ICP.
This becomes your single source of truth for all future outbound campaigns so every SDR, marketer, or ops specialist pulls from the same clean base, not fragmented spreadsheets.
Why TAM mapping matters
Most outbound programs fail at this stage because they treat TAM like a “data list,” not a strategic asset.
Without a unified TAM, you can’t measure coverage, prioritize outreach, or scale reliably.
A well-built TAM enables:
- Predictability: every new campaign draws from the same, qualified pool.
- Efficiency: no time wasted chasing duplicates or irrelevant accounts.
- Alignment: marketing, SDRs, and leadership operate from the same universe of target accounts.
In short, TAM mapping transforms outbound from randomized prospecting into structured market coverage.
Data sources: where the market universe comes from
No single provider gives you a full picture of your market.
Each one has coverage gaps and data biases which is why we always triangulate across multiple sources for completeness and accuracy.
1. Apollo & LinkedIn Sales Navigator: core TAM foundation
These are our system-of-record tools for baseline firmographics.
From Apollo and Sales Navigator, we extract:
- Company name and domain
- Industry and sub-industry
- Headcount and employee ranges
- Geographic footprint (HQ + regional operations)
- Ownership, funding, or growth indicators (when available)
We use these to:
- Build the baseline TAM for each target segment or region.
- Create saved searches that directly apply the ICP filters defined in Step 1.
- Export account batches for further enrichment downstream.
2. Ocean.io & discoLike: lookalike expansion tools
Even with a solid base, Apollo and LinkedIn miss many accounts.
That’s where tools like Ocean.io or DiscoLike help extend the TAM through lookalike modeling.
We use these when:
- The initial TAM is strong but incomplete.
- We want to find companies that behave like our best customers, not just look like them.
Typical outputs include:
- Companies with similar web traffic profiles, tech stacks, or digital categories.
- Emerging segments that match ICP logic but aren’t captured in static filters.
3. Apify & easyScraper: niche and long-tail TAM capture
When targeting niche verticals or micro-segments, generic databases fail.
That’s when we deploy custom scraping through tools like Apify or EasyScraper to extract data from:
- Industry directories and listing sites.
- Event sponsor or exhibitor pages.
- Association membership lists or review platforms (e.g., G2, Capterra).
- Search results tied to intent keywords (e.g., “best HR analytics tools 2025”).
Clay processing flow: turning raw data into a clean TAM
Raw account data from multiple sources is messy, filled with duplicates, inconsistencies, and junk entries.
We use Clay (or an equivalent data operations layer) as our TAM processing engine, transforming raw inputs into a structured market dataset.
The workflow is:
Dedupe → Filter → Normalize → Qualify → Segment
1. Dedupe: removing overlap across sources
Objective: Eliminate duplicate companies so every account appears once.
We:
- Standardize on a primary key, usually the company domain.
- Merge variations (e.g., “Acme Inc.” vs “Acme Incorporated”).
- Keep the richest record when duplicates exist (most complete data fields).
Outcome: a single, unified account per domain, no overlaps, no wasted outreach.
2. Filter: enforcing ICP alignment
Objective: Ensure only accounts that meet the ICP rules from Step 1 remain in the TAM.
We:
- Exclude companies that don’t meet minimum thresholds (size, region, industry).
- Remove irrelevant entities like agencies, freelancers, or resellers.
- Apply negative ICP logic to filter out poor-fit segments.
Outcome: a clean, relevant TAM and not a generic B2B contact list.
3. Normalize: creating a consistent data schema
Objective: Standardize fields for consistent analysis and routing.
Normalization steps:
- Map provider-specific industry labels to a common taxonomy.
- Consolidate geographic names (“USA,” “United States,” “US” → “United States”).
- Align headcount and revenue into consistent buckets for scoring.
Outcome: a structured, sortable dataset ready for enrichment, scoring, and segmentation.
4. Qualify: separating high-fit from borderline accounts
Objective: Add early qualification signals before SDRs engage.
We:
- Enrich with basic tech stack data (from BuiltWith, Wappalyzer, etc.).
- Apply rules-based qualification (e.g., “must have ≥10 employees in marketing or sales”).
- Flag accounts for manual review when data confidence is low.
Outcome: a TAM labeled by qualification status, so teams know where to focus first.
5. Segment: structuring TAM for campaign precision
Objective: Break the TAM into smaller, actionable sub-segments for personalized plays.
Segmentation axes include:
- Sub-industry: fintech, edtech, logistics, etc.
- Company size: SMB, mid-market, enterprise.
- Tech stack: Snowflake users, HubSpot users, specific competitor tools.
- Region: US, UKI, DACH, ANZ, etc.
These segments drive:
- Designed messaging and angles.
- SDR-specific outreach plays.
- Different levels of personalization and effort.
Outcome: a TAM that can be sliced, targeted, and scaled systematically.
Step 3: account research
After mapping your Total Addressable Market (TAM), you now have a clean universe of potential accounts.
But knowing who exists isn’t enough.
To drive response and pipeline, you need to understand each account in context.
That’s where Account Research comes in. The process that transforms a basic company record into a high-resolution profile enriched with firmographic, technographic, and behavioral intelligence.
This step is what turns outbound from cold to contextual.
The goal is simple but critical:
Understand each account well enough to know what to say, when to say it, and whether it’s worth saying anything at all.
We achieve that through 4 structured research layers and a signal-tracking stack that keeps everything dynamic and up to date.
Why account research is essential
Without research, even a perfect TAM and ICP won’t perform.
Generic outreach collapses because prospects don’t feel understood.
When done well, account research produces three key outcomes:
1. Relevance: every message connects to a real pain or priority.
2. Prioritization: SDRs focus where the strongest buying signals exist.
3. Conversion: outbound feels personalized, not automated.
In the Outbound GTM Framework, account research is the bridge between data accuracy (TAM) and sales impact (pipeline).
Research layers: from structure to signals
Each research layer adds a new level of depth to how you understand an account.
Together, they provide the context you need to personalize, prioritize, and convert.
1. Firmographics: structural context
Firmographics form the backbone of account understanding.
They answer the question:
“What type of company is this, and where do they fit within our ICP?”
We capture and verify:
- Industry and sub-industry classification
- Headcount ranges (overall and departmental, when possible)
- HQ and regional locations
- Funding stage, investors, and ownership structure
- Growth indicators (e.g., hiring surges) or decline signals (e.g., layoffs)
Why it matters:
Firmographics dictate how you segment, tier, and allocate effort.
An enterprise account might require multi-threaded outreach and ABM-style messaging, while an SMB might respond better to shorter, direct campaigns.
This layer ensures outbound execution matches company structure.
2. Technographics: system compatibility and problem context
Technographics describe the tools, systems, and platforms a company uses.
They reveal two things:
1. The environment your solution needs to fit into.
2. The problems likely to arise within that environment.
We track:
- Cloud and infrastructure stack (AWS, GCP, Azure)
- Core systems (CRM, ERP, data warehouse, analytics tools)
- Competitor or adjacent products already in use
- Integration dependencies
- Security and compliance software
Why it matters:
Knowing what tools an account already uses shapes your message.
“Teams using X often struggle with Y” lands far better than a one-size-fits-all pitch.
It’s also a practical filter for technical compatibility during qualification.
3. Fit signals: prioritizing the right accounts
Fit signals reveal when an account is likely to buy.
They reflect timing, readiness, and intent, helping SDRs focus energy where momentum already exists.
Common fit signals include:
- SOC2 or ISO compliance announcements
- Rapid hiring in target departments (e.g., sales, ops, or marketing)
- Leadership transitions (new CRO, VP RevOps, CTO)
- Funding events or acquisitions
- Product launches, rebrands, or strategic pivots
- Job postings that imply adoption of your category
Why it matters:
These signals feed directly into lead scoring (Step 4).
They separate “good-fit, low-readiness” accounts from those in an active buying cycle — allowing outbound to strike at the right time.
4. Custom fields: designing to what actually drives success
Every GTM motion is unique, so we layer in custom fields based on what correlates with revenue in your model.
Examples include:
- Business model: SaaS, marketplace, or B2B/B2C hybrid
- Revenue model: subscription vs. transactional
- Customer segment: SMB, mid-market, or enterprise
- Operational complexity: number of SKUs, data sources, or offices
- Industry-specific nuances (e.g., compliance, logistics, procurement structure)
Why it matters:
Custom fields localize your outbound.
They make your messaging sound like it was written inside the prospect’s industry, not from an outsider guessing.
Signal tracking stack
Research gives you static intelligence: who a company is, what they do, and how they operate.
But outbound timing depends on motion, signals that indicate change, interest, or buying intent.
That’s where signal tracking comes in.
It’s the layer that keeps your TAM alive, enabling SDRs to act on movement instead of cold data.
1. Trigify: social engagement intelligence
Trigify monitors LinkedIn engagement patterns that correlate with interest or intent.
We use it to track:
- When target personas engage with relevant industry content.
- When they comment on or react to competitor posts.
- When they follow or mention key topics.
- How their behavior trends around buying cycles.
2. LoneScale: champion and org movement tracking
LoneScale helps us map and monitor champions, stakeholders, and internal job movements.
We use it to:
- Identify past champions who’ve switched companies.
- Track leadership changes that create new entry points.
- Understand org structure and reporting lines.
- Expand multi-threading across multiple stakeholders.
3. Warmly: website Intent and deanonymization
Warmly identifies which companies are visiting your website even before they fill out a form.
We analyze:
- Which pages were viewed (pricing, product, case study).
- Visit frequency and session patterns.
- Return visits that signal deeper research or interest.
Step 4: lead scoring
At this stage of the Outbound GTM Framework, you’ve built your TAM universe and enriched it with detailed account research.
Now, you need a way to convert that data into focus to determine where to act first and how much effort each account deserves.
That’s the job of lead scoring.
It creates the operational discipline that separates strategic outbound from random activity.
The goal is simple:
- Which accounts deserve manual effort right now
- Which can be worked through scalable sequences
- Which stay in the background until signals improve
Without a scoring system, SDRs treat every account the same. The result? Wasted time, inconsistent pipeline, and an outbound engine clogged with noise.
We solve this through clear tiers and explicit scoring factors that align effort to opportunity.
Tiering model: where strategy meets execution
You don’t need a complicated scoring matrix.
Three tiers are enough to structure any outbound program: balancing personalization, scalability, and coverage.
Tier 1: manual + calls: high-intent, high-value targets
Who belongs here:
Your best-fit accounts with visible signals of readiness or urgency.
These are companies that mirror your top customers or represent strategic logos you want to win.
Typical characteristics:
- Strong ICP match across firmographics, technographics, and region.
- Multiple positive fit signals like compliance deadlines, funding, or team growth.
- Recent trigger events such as leadership hires or expansions.
Outbound motion:
- Full account-level research before outreach.
- Multi-threaded engagement across stakeholders.
- Personalized cold calls + email + LinkedIn touchpoints.
- Custom messaging linked to their stack, model, or stage.
- Persistent follow-up with structured next steps.
Tier 2: multichannel: ICP-fit with lower intent
Who belongs here:
Accounts with a strong structural fit but limited or no visible intent yet.
Typical characteristics:
- Clear ICP alignment (industry, size, region).
- Solid tech stack match.
- Few or weaker buying signals but no disqualifiers.
Outbound motion:
- Automated but multichannel sequences (email + LinkedIn).
- Light personalization at the segment or vertical level.
- Continuous monitoring for new signals (web visits, social engagement, job changes).
- Escalate to Tier 1 if meaningful intent appears.
Tier 3: automated: maintain breadth, capture serendipity
Who belongs here:
Accounts that meet minimum ICP standards but lack strong signals or enrichment.
Typical characteristics:
- Basic match on industry, region, and size.
- Limited context on stack or activity.
- No recent intent-like events.
Outbound motion:
- Automated, low-frequency sequences.
- Still ICP-relevant but more generic messaging.
- Focused on discovery, surfacing new interest from unexpected sources.
- Continuous monitoring to promote to Tier 2 or Tier 1 when new data emerges.
Scoring framework: how we rank and route accounts
To assign accounts into tiers objectively, we use a three-dimensional model:
Fit → Intent → Triggers.
Each dimension can be expressed as a numeric score, a tag, or both depending on your data maturity and tech stack.
1. Fit: how well do they match the ICP?
Fit measures structural suitability.
In simple terms: If they had a need, would they be a great customer?
Inputs include:
Firmographics:
- Industry and sub-industry alignment
- Employee range within target bands
- Geographic fit (region or market served)
Technographics:
- Uses core tools you integrate with
- Uses competitor products you can replace
- Demonstrates relevant tech maturity (data stack, automation tools, etc.)
Structural attributes:
- Business model fits your value proposition
- Deal potential aligns with target ACV
2. Intent: are they showing interest or awareness now?
Intent measures activity and interest around your category.
It’s dynamic and shifts constantly.
Inputs include:
Website behavior (via Warmly, Clearbit, etc.):
- Visits from target accounts
- High-intent pages viewed (pricing, product, demo)
- Repeat visits or multiple sessions in a short timeframe
Social and content engagement (via Trigify or similar):
- Interactions with your company or competitor content
- Comments or reactions to relevant topics
- Follows or mentions of category thought leaders
Other signals:
- Attending relevant events or webinars
- Downloading resources or guides in your space
3. Triggers: why now?
Triggers are time-bound events that indicate urgency, the “why now” moment.
Company-level triggers:
- Funding rounds or M&A events
- New market entries or expansions
- Major product launches
Team-level triggers:
- Leadership hires (VP Sales, CRO, CTO)
- Rapid team scaling in key functions
- Departmental restructuring
Environmental triggers:
- New compliance or regulatory mandates
- Public announcements around security or infrastructure milestones
Step 5: contact sourcing
Once your accounts are scored and tiered, one question remains:
Who exactly are we talking to inside each company?
That’s where Contact Sourcing comes in. The process of mapping every relevant decision-maker, influencer, and user within your target accounts.
Modern B2B deals rarely hinge on one person.
If you only contact a single individual, you’re betting on luck.
If you systematically map and engage the entire buying committee, you’re building a repeatable process.
The objective here is to create complete, verified, role-based contact sets for each account, giving your SDRs a clear path to multithreaded engagement.
Why contact sourcing matters
The average B2B deal today involves 6–10 stakeholders across multiple departments (Gartner, 2023).
That means your outbound program isn’t about finding the decision-maker, it’s about orchestrating buying consensus across multiple perspectives.
A robust contact sourcing system ensures:
- Every tiered account has full coverage across functions.
- Messaging is tailored by persona, not just job title.
- SDRs know exactly who to reach and how to sequence them.
In the Outbound GTM Framework, contact sourcing is the bridge between account scoring and personalized outreach, transforming targeting from theoretical to tactical.
Tools we use for contact sourcing
No single database gives you perfect coverage.
Each provider has blind spots in regions, functions, or data freshness.
We combine multiple sources to balance accuracy, completeness, and verification.
1. Findymail: primary email discovery & verification
Purpose: Find and verify emails at scale.
We use Findymail as the first line of sourcing because of its built-in verification engine, which reduces bounce rates and protects sender reputation.
How we use it:
- Pull emails for specific roles or functions within target accounts.
- Filter by region, seniority, and department.
- Automatically verify and deduplicate contacts before importing.
2. BetterContact: enrichment for direct dials
Purpose: Add high-quality phone numbers for Tier 1 or phone-led sequences.
How we use it:
- Enrich sourced contacts with direct dials and validated phone numbers.
- Build call lists for SDRs alongside email and LinkedIn plays.
- Prioritize for Tier 1 accounts, or Tier 2 when phone is a key channel.
3. Apollo Enrich: coverage expansion & cross-verification
Purpose: Fill gaps and expand contact coverage when other tools miss key personas.
How we use it:
- Identify additional contacts in missing or adjacent functions (e.g., Ops, Data, Finance).
- Cross-check titles, seniority, and department accuracy.
- Surround known champions with influencers, users, and decision-makers to multithread outreach.
Mapping the buying committee
We never stop at “Head of X” or “CTO.”
Instead, we build a standardized buying committee map that SDRs aim to fill per account.
Each function represents a perspective in the deal, and each one demands its own message strategy.
1. Exec: strategic direction and budget ownership
Typical roles: CEO, COO, CRO, CPO, CDO, VP-level leadership.
Why they matter:
- Hold budget and final sign-off authority.
- Drive top-down initiatives tied to revenue, risk, or operational efficiency.
- Valuable for high-level narratives about ROI, impact, and growth outcomes.
How to engage:
Use concise, strategic messaging. One or two high-quality touchpoints tied to business impact often outperform longer sequences.
2. Ops: process owners and execution drivers
Typical roles: VP Operations, Head of RevOps, Business Ops, Operations Manager.
Why they matter:
- Own the workflows and daily execution layers.
- Directly feel operational pain points your product solves.
- Often act as project owners or internal sponsors during evaluation.
How to engage:
Mid-funnel conversations around process improvement, automation, and efficiency.
They convert on proof of speed and reduced complexity.
3. Tech: feasibility and integration guardians
Typical roles: CTO, VP Engineering, Head of Data, Architect, IT Director.
Why they matter:
- Own system integration, data security, and technical validation.
- Act as gatekeepers for adoption, no tech sign-off, no deal.
- Need reassurance around reliability, scalability, and maintenance.
How to engage:
Focus messaging on integration, risk mitigation, and security compliance.
Back every claim with concrete proof (APIs, certifications, uptime SLAs).
4. Finance: ROI, cost, and risk evaluation
Typical roles: CFO, VP Finance, Controller, Head of FP&A.
Why they matter:
- Own budget approvals and financial validation.
- Evaluate ROI, payback periods, and cost-benefit ratios.
- Can accelerate or halt deals late in the cycle.
How to engage:
Use data-backed ROI narratives, total cost of ownership (TCO), risk reduction, and payback models.
Finance personas don’t respond to emotion; they respond to math.
5. End-User: real-world advocates and product champions
Typical roles: ICs or managers in the relevant function (Marketing Manager, Data Analyst, CS Lead).
Why they matter:
- Live with the pain daily.
- Validate practical benefits and usability.
- Can become powerful internal champions or blockers based on experience.
How to engage:
Outreach should be practical and empathetic.
Ask discovery questions about workflow friction or tool limitations.
They’re your gateway to credible insights and user-level proof.
Step 6: message-market fit
Up to this point, your Outbound GTM Framework has focused on who to target and how to prioritise them.
Now it’s time to decide what to say and how to say it so that those carefully selected accounts actually respond.
Most outbound programs fail here not because the market is wrong, but because the message is misaligned.
The wrong pain. The wrong value prop. The wrong level of specificity.
That’s why we treat messaging as an ongoing experiment system, not a one-time copy project.
The objective is to systematically test messaging variables until you identify combinations that produce consistent, high-intent replies for each segment.
Testing framework: variables we experiment with
We never change everything at once.
Each test isolates one or two variables so we can pinpoint exactly what moved the needle.
1. Openers: earning the first read
Openers determine whether the rest of the message ever gets read.
We test four core types:
- Context-based: “Saw you recently [hiring for X / announcing Y / launching Z]…”
- Role-based: “As a [title], you’re likely dealing with …”
- Stack-based: “Teams running on [Snowflake / HubSpot / X tool] usually hit a wall with …”
- Outcome-based: “Most [ICP] we speak with are trying to hit [metric] without adding headcount.”
We track which opener types drive the highest open-to-reply ratios per segment.
2. Value props: explaining why change matters
Value propositions communicate what improves when the buyer adopts your solution.
We vary:
- Core benefit: revenue ↑ / cost ↓ / risk ↓ / speed ↑ / accuracy ↑.
- Specificity: generic vs quantified (“reduce manual reporting” → “cut reporting time by 60 %”).
- Layer: IC-level productivity, manager-level efficiency, exec-level strategy.
Example adaptations for one product:
- Exec: “Shorten sales cycles and improve forecast accuracy.”
- Ops: “Remove manual hand-offs and fix pipeline leakage.”
- Tech: “Integrate with your stack without adding maintenance overhead.”
3. Problem calls: validating pain relevance
Problem calls articulate the pain you’re solving and verify whether it’s real enough to spark interest.
We test:
- Depth: minor annoyance vs critical blocker.
- Focus: time, compliance, cost, growth, or complexity.
- Ownership: framed as their problem, their team’s, or their customer’s.
Example pattern:
“Most [ICP] we talk to still rely on [current workaround], which leads to [specific friction].”
4. Social proof: borrowed trust
Social proof links who you’ve helped with what changed for them.
We vary:
- Type: logos, named customers, anonymised case studies (“Series C fintech”), quantified results.
- Proximity: same industry, size, or tech stack.
- Placement: early vs near CTA.
Examples:
- “We’re working with [peer company] to cut [process] from [X hours] to [Y minutes].”
- “Teams like [Logo 1, Logo 2] use us to [achieve outcome].”
5. Offers: defining the next step
The “offer” is what the prospect receives if they reply, not always a demo.
We test:
- Type: demo / audit / teardown / benchmark / short call.
- Friction: high (“45-minute deep dive”) vs low (“share benchmarks, you decide next”).
- Format: resource-led (playbook, checklist) vs product-led (walk-through).
Segment examples:
- Tier 1 execs: respond to strategic insights or benchmarks.
- Tier 2 managers: prefer quick, tactical walk-throughs.
6. CTAs: guiding commitment
CTAs define the micro-conversion you’re asking for.
We test:
- Soft: “Worth a quick look?” / “Open to exploring this?”
- Time-based: “Are you free for 20 minutes next week?”
- Choice-based: “Is this more relevant to you or [other role]?”
Execution layer: structured message testing
Once hypotheses are defined, we operationalise them through sequencing tools.
1. Instantly: email testing at scale
Purpose: Controlled A/B testing inside outbound email sequences.
We use Instantly to:
- Build multi-step sequences with isolated variables.
- Split-test subject lines, body variants, and CTAs.
- Monitor deliverability, opens, replies, and spam flags.
- Gradually roll proven winners into larger segments.
2. HeyReach: linkedIn messaging validation
Purpose: Contextual testing through LinkedIn outreach.
We use HeyReach to:
- Run connection + follow-up sequences by persona.
- Compare connection-note and follow-up variants.
- Align timing with email sequences for Tier 1 & Tier 2 accounts.
- Analyse which angles resonate per role.
Step 7: scale
Scaling is where most outbound programs fall apart.
Teams see early success with a small, well-managed segment then try to “turn up the volume” without ensuring the engine is ready.
The result?
Deliverability collapses.
Reply quality tanks.
SDRs drown in noise.
Pipeline regresses instead of expanding.
At this stage of your Outbound GTM Framework, the goal isn’t to do more.
It’s to increase throughput, more accounts, more contacts, more sequences without diluting quality or damaging your sending reputation.
Scaling only happens after the system is stable, validated, and consistently producing positive intent.
When to scale
We scale only when three non-negotiable conditions are met:
- Positive intent
- Proven angle
- Stable deliverability
These act as your “go/no-go” checks for volume increases.
1. Positive Intent: real interest, not just replies
Before scaling, we look beyond raw metrics.
It’s not enough to see high open or reply rates, we need positive, qualified intent that leads to pipeline.
We track:
- % of positive replies (interest, questions, meeting requests)
- Meetings booked per 100–200 contacts messaged
- Conversion rates from reply → meeting → opportunity
Decision rules:
- If reply rates are high but replies are neutral (“not now,” “not relevant”) → messaging is off.
- If positive intent is consistent within a segment, that segment is ready to scale.
2. Proven angle: replicable narrative
Scaling unproven messaging just creates louder inefficiency.
We define a proven angle as:
- A specific, validated segment (e.g., “Heads of Data at mid-market SaaS using Snowflake”).
- A clear problem narrative and value prop that has already delivered:
- Multiple positive replies
- Multiple meetings
- Early pipeline or opportunities
We also check for:
- Consistency across SDRs: it works for more than one person.
- Repeatability across accounts: it performs across multiple companies within the segment.
If success came from one SDR and one account, it’s a signal, not proof.
We scale only when we see repeatable conversion patterns.
3. Stable deliverability: protect the engine
Outbound scaling with poor deliverability is like accelerating a car with a clogged engine.
Before increasing volume, we check:
- Bounce rate: remains low and stable.
- Spam indicators: minimal or none.
- Open rates: healthy and consistent by region.
- Domain/IP health: monitored across all sender domains.
If:
- New domains are still warming up, or
- You see dips in open rates or spikes in bounces → pause.
How we scale (without losing control)
When those three conditions are met, scaling happens intelligently through controlled levers, not brute-force sending.
1. Add more SDRs
We expand human capacity while maintaining system discipline.
How we do it:
- New SDRs are onboarded using the same validated plays (ICP, segments, sequences, messaging).
- Each SDR gets a defined account pool (Tier 1 and Tier 2) with clear ownership.
- Performance variance between SDRs is tracked to detect skill or messaging gaps.
2. Expand to adjacent personas: depth before breadth
Once a message works for one role, we expand laterally within the same account type.
Example:
If “Head of Data” performs well, we next test:
- Director of Data
- VP of Data / CDO
- Analytics Lead
- Head of Platform / Data Engineering
If “VP of Operations” converts well, we add:
- COO
- RevOps Lead
- Business Operations
- Operations Manager
This approach helps us:
- Increase coverage within each account.
- Discover new champions or buying influences.
- Test message transferability across related personas.
3. Add new data sources
When a segment and message set prove stable, we expand horizontally by adding new data streams but through the same system.
We include:
- New provider segments (e.g., Apollo, Sales Navigator).
- Lookalike expansions from Ocean.io or DiscoLike.
- Niche account lists scraped via Apify or EasyScraper.
- New geographies or sub-industries with shared characteristics.
Each new input goes through the same pipeline:
ICP → TAM → Research → Scoring → Contact Sourcing → Messaging → Testing
The GTM flywheel
Outbound performs at its best when it doesn’t operate in isolation.
Even the strongest outbound engine: tight ICP, clean TAM, deep research, validated messaging can underdeliver if it runs disconnected from the broader go-to-market system.
That’s why we use the GTM Flywheel as our overarching model.
The flywheel captures how different motions: Content, Paid, Outbound, and Partnerships reinforce one another through shared signals, shared messaging, and shared audiences.
Instead of running linear campaigns that start and stop, we build a loop where every motion strengthens the next.
The outcome:
- Faster trust-building
- Higher reply rates
- Better-quality meetings
- Shorter sales cycles
Each motion targets the same ICP, but through a different entry point.
Together, they transform outbound from a cold touch into a recognised, credible, and familiar experience, the difference between a stranger’s email and a trusted expert’s invitation.
The four GTM motions
1. Content
Content creates familiarity, relevance, and authority long before an SDR ever reaches out.
We produce and distribute content designed to educate first, sell later:
- Thought leadership posts on LinkedIn
- Playbooks, frameworks, and teardown-style analyses
- Industry-specific insights and commentary
- Slide-style and short-form video content that solves real problems
When prospects encounter your content before an outbound message, several powerful effects occur:
- Reply rates rise because they already recognise your brand or team members.
- Resistance drops because you’ve demonstrated credibility in advance.
- Messaging becomes easier, since SDRs can reference content directly (“you may have seen our breakdown on GTM data workflows…”).
2. Paid
Paid media amplifies reach and pre-conditions the exact ICP that SDRs are contacting.
It’s how we make sure our message is already familiar before an SDR’s first touch.
We deploy:
- Retargeting campaigns for high-intent visitors and account lists
- Persona-targeted ads for Ops, Data, Finance, and Tech leaders
- Case study and proof-led creative
- Content promotion ads to extend organic reach
The goal isn’t lead generation, it’s impression alignment:
The same people seeing ads are the ones in outbound sequences.
How it plays out:
1. The ICP sees a relevant ad.
2. They recognise the name or idea.
3. The outbound message lands while awareness is fresh.
4. Reply and meeting rates increase.
3. Outbound
Outbound remains the most controllable and direct motion in the GTM Flywheel.
It converts the attention created by other motions into real conversations and pipeline.
Outbound becomes exponentially stronger when it’s supported by the rest of the system:
- Prospects have seen your content → credibility.
- Prospects have seen your ads → familiarity.
- Prospects have heard your name via partners or peers → trust.
At that point, an outbound message isn’t “cold.”
It’s simply the next logical touchpoint in an ongoing series of impressions.
4. Partnerships
Partnerships inject external credibility and shared distribution into the flywheel.
These can include:
- Integration and technology partners
- Channel and referral partnerships
- Affiliate networks
- Industry communities or associations
- Co-marketing or co-selling with adjacent solutions
Partnerships create third-party validation, trust that can’t be self-declared.
They also unlock:
- Warmer audiences and shared ICPs
- Niche verticals and micro-communities
- Joint go-to-market opportunities (events, webinars, case studies)
- Lower-cost lead sourcing and more efficient list building
When a prospect hears about you from a partner, sees your content, engages with your ads, and then receives an outbound message, the likelihood of conversion multiplies.
Conclusion
A high-performing outbound engine isn’t built from isolated tactics.
It’s built from a repeatable system where ICP clarity, TAM precision, deep research, structured scoring, buying-committee sourcing, and message–market fit all compound into one predictable, scalable pipeline.
The 7-Step Outbound GTM Framework you’ve just seen is the backbone of that system:
1. ICP Model → define exactly who you want.
2. TAM Mapping → build the richest, cleanest universe possible.
3. Account Research → layer in signals, context, and depth.
4. Lead Scoring → prioritise with precision and consistency.
5. Contact Sourcing → map the real buying committee.
6. Message–Market Fit → test until replies become repeatable.
7. Scale → expand only once the engine is stable and validated.
When these seven components run inside the GTM Flywheel, content, paid, outbound, partnerships, outbound stops being “cold.”
Prospects recognise your brand, trust your expertise, and understand your value before the first message even lands.
That’s why this framework consistently drives 300+ meetings per month across multiple ICPs and industries.
At Workflows.io, we don’t just advise on outbound, we build the full system for you.
If you want a go-to-market engine that produces predictable pipeline every month, we’ll help you design, implement, and optimise the exact framework you’ve just read:
- ICP and TAM definition
- Signal-based scoring and sourcing
- Multichannel outbound setup
- Messaging experimentation and playbooks
- Scalable SDR workflows
Whether you’re launching outbound for the first time or rebuilding a motion that’s plateaued, we’ll help you build a complete, data-backed GTM system that compounds over time.
Visit Workflows.io to see how we can help you build, scale, and optimise your GTM engine end-to-end.


